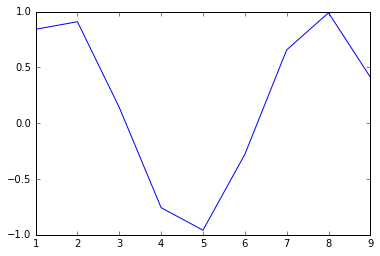
2016-10-22 jupyter demo jupyter This is a demo1%matplotlib inline 12345import numpy as npimport matplotlib.pyplot as pltx=xrange(1,10)y = np.sin(x)plt.plot(x,y) [<matplotlib.lines.Line2D at 0x75590f0>] 本文标题:jupyter demo 文章作者:liuzhongling 发布时间:2016-10-22, 19:08:48 最后更新:2016-10-22, 19:20:40 原始链接:http://yoursite.com/2016/10/22/jupyter-demo/ 许可协议: "署名-非商用-相同方式共享 4.0" 转载请保留原文链接及作者。 fight